拿 x 数据列举例,如果误差用标准差 σx 来表示,那么数据取值范围可以表示为 [x-σx, x+σx],这时候只要增加一列误差项就行了,所以一共需要 3 列数据。如果误差用最小值 xmin 和最大值 xmax 来表示,那么数据取值范围可以表示为 [xmin, xmax],这时候需要增加两列误差项,所以一共需要 4 列数据。对于 y 数据误差,表达方法和 x 类似。如果同时包含 x 和 y 误差,就需要把两者结合起来。
在 gnuplot 里,error bar 的基本使用方法是:
plot "数据文件名" using
using 命令在之前的“多组数据绘图”博文里已经介绍过,目的是选择哪些列数据进行绘图,数据列数必须和后面选择的绘图方式对应。with 命令后面跟的是绘图方式,选择用 xerrorbars,yerrorbars,还是 xyerrorbars。根据不同绘图方式,所需数据列数分别为:
- xerrorbars
- 3 列:x y σx
- 4 列:x y xmin xmax
- yerrorbars
- 3 列:x y σy
- 4 列:x y ymin ymax
- xyerrorbars
- 4 列:x y σx σy
- 6 列:x y xmin xmax ymin ymax
### 文件开始 ###
# Ave Energy Probability Min Energy Max Energy Energy SD
# (micro J) (%) (micro J) (micro J) (micro J)
# =======================================================================
9.08 0 8.96 9.15 0.06
10.00 2 9.91 10.08 0.05
10.52 3 10.41 10.60 0.06
11.03 10 10.90 11.11 0.06
11.52 25 11.38 11.62 0.07
12.03 57 11.90 12.13 0.07
12.52 88 12.38 12.64 0.08
13.01 93 12.86 13.09 0.07
13.51 100 13.38 13.61 0.08
14.52 100 14.38 14.67 0.08
### 文件结束 ###
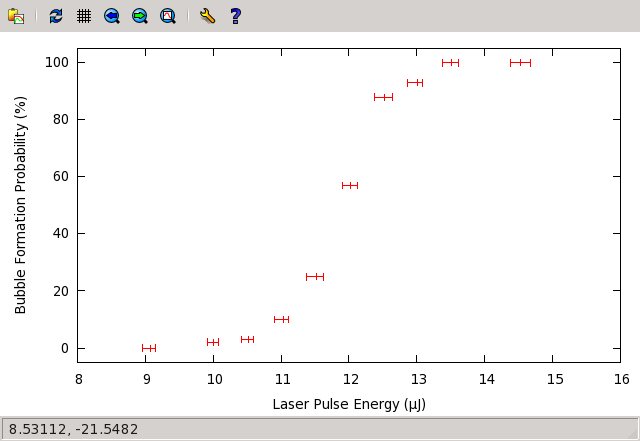
x 轴数据为激光能量,y 轴数据为气泡产生几率,这里只有 x 误差,并且同时包含了最小最大值和标准差。我们现在用最小最大值画图:
gnuplot> set xrange [8:16]
gnuplot> set yrange [-5:105]
gnuplot> unset key
gnuplot> set xlabel "Laser Pulse Energy (μJ)"
gnuplot> set ylabel "Bubble Formation Probability (%)"
gnuplot> plot "probability.dat" using 1:2:3:4 with xerrorbars
如果既要画 error bar,又要连线,可以把上述命令中的 errorbars 换为 errorlines:
gnuplot> plot "probability.dat" using 1:2:3:4 with xerrorlines
拟合
gnuplot 除了绘图功能之外,最简单实用的功能就是拟合了。gnuplot 可以进行单变量甚至多变量的线性和非线性拟合。虽然可能不像专门的数学软件那么强大,但是足以对付日常需要了。我们拿上一篇文章里的数据来举例子。
首先,要定义一个待拟合的函数:
gnuplot> f(x)=50*(1+erf(a*(x-b)))
这里使用了误差函数 erf(x),有两个待定的参数:a, b。下面我们生成一个文件“fit.par”,里面包含的是参数 a 和 b 的初值:
a = 1
b = 12
初值的选择要尽可能贴近结果,否则可能导致误差甚至无法收敛。下面我们进行拟合:
gnuplot> fit [8:16] f(x) 'probability.dat' using 1:2 via 'fit.par'
gnuplot 里面关于拟合的命令是 fit,后面的自变量取值范围不是必需的。f(x) 函数已经在上面定义过了,数据文件“probability.dat”也已经在上一篇博文中交代过了。via 后面跟的是参数变量列表文件。执行 fit 命令之后,gnuplot 会输出一堆结果。我们忽略那些中间运算,只把最后结果贴在下面:
After 5 iterations the fit converged.
final sum of squares of residuals : 41.9399
rel. change during last iteration : -4.27973e-07
degrees of freedom (FIT_NDF) : 8
rms of residuals (FIT_STDFIT) = sqrt(WSSR/ndf) : 2.28965
variance of residuals (reduced chisquare) = WSSR/ndf : 5.24249
Final set of parameters Asymptotic Standard Error
======================= ==========================
a = 1.15661 +/- 0.06331 (5.474%)
b = 11.9027 +/- 0.02383 (0.2002%)
correlation matrix of the fit parameters:
a b
a 1.000
b 0.014 2.000
这段文字说明,经过 5 次迭代,gnuplot 得到了收敛的结果。中间部分是参数 a 和 b 的最终取值以及渐近标准差(asymptotic standard error)。渐近标准差的计算是基于线性拟合的,对于非线性拟合,渐近标准差一般都比真的标准差小,所以这个数字只能用于定性分析。而最后给出的相关矩 阵(correlation matrix)可以帮助我们确认渐近标准差的可靠度,非对角元素绝对值越小,渐近标准差越接近真实标准差。
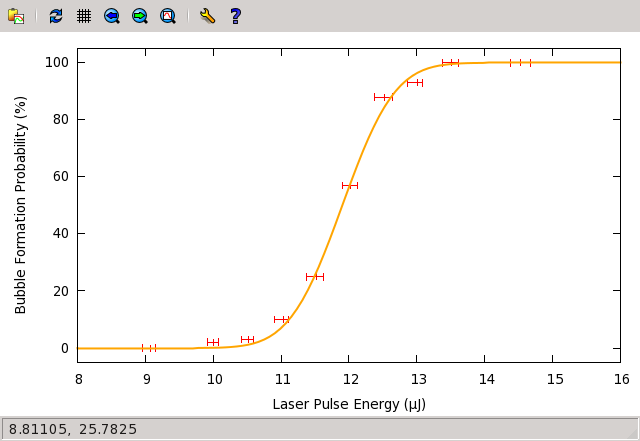
好了,现在我们可以把数据和拟合曲线画在同一张图上了:
gnuplot> set xrange [8:16]
gnuplot> set yrange [-5:105]
gnuplot> unset key
gnuplot> set xlabel "Laser Pulse Energy (μJ)"
gnuplot> set ylabel "Bubble Formation Probability (%)"
gnuplot> plot "probability.dat" using 1:2:3:4 with xerrorbars, f(x) lw 2 lc rgb "orange"


