1.timeit:
>>> import timeit
>>> def fun(): for i in range(100000): a = i * i

>>> timeit.timeit('fun()', 'from __main__ import fun', number=1) 0.02922706632834235 >>>
2.profile
>>> import profile
>>> def fun():
   for i in range(100000):
      a = i * i


>>> profile.run('fun()')
         5 function calls in 0.031 seconds

   Ordered by: standard name

   ncalls  tottime  percall  cumtime  percall filename:lineno(function)
        1    0.000    0.000    0.016    0.016 :0(exec)
        1    0.016    0.016    0.016    0.016 :0(setprofile)
        1    0.016    0.016    0.016    0.016 :1(fun)
        1    0.000    0.000    0.016    0.016 :1()
        1    0.000    0.000    0.031    0.031 profile:0(fun())
        0    0.000             0.000          profile:0(profiler)


>>>
3.cProfile
>>> import cProfile
>>> def fun():
   for i in range(100000):
      a = i * i


>>> cProfile.run('fun()')
         4 function calls in 0.024 seconds

   Ordered by: standard name

   ncalls  tottime  percall  cumtime  percall filename:lineno(function)
        1    0.024    0.024    0.024    0.024 :1(fun)
        1    0.000    0.000    0.024    0.024 :1()
        1    0.000    0.000    0.024    0.024 {built-in method exec}
        1    0.000    0.000    0.000    0.000 {method 'disable' of '_lsprof.Profiler' objects}


>>>
ncalls、tottime、percall、cumtime含义同profile。
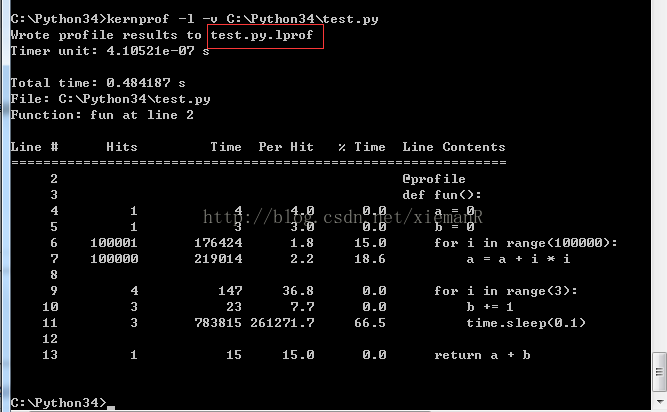
4.line_profiler
安装:
测试代码:
import time


@profile def fun():
    a = 0  b = 0  for i in range(100000):
        a = a + i * i for i in range(3):
        b += 1  time.sleep(0.1) return a + b


fun()
使用:
5.memory_profiler:
安装:
pip install memory_profiler测试代码:
使用:
1.在需要测试的函数加上@profile装饰2.执行命令: python -m memory_profiler C:\Python34\test.py
输出如下:

6.PyCharm图形化性能测试工具:
7.objgraph:
pip install objgraph
图形化分析原始文件:目前推荐 snakeviz
pip 安装 snakeviz 后,在 Anaconda prompt 里运行如下命令:
snakeviz result.out
然后就会在弹出一个 snakeviz 的本地网页,可以在网页上自由点击查看哪个代码最耗时,非常直观方便:
其他图形化工具:我试过 gprof2dot,感觉总体上不如 snakeviz 简单、直接、美观。简单方面,用 gprof2dot 前需要安装 graphviz,安装完成后还需要把 graphviz 安装目录下的 bin 文件夹添加到环境路径 Path,而 snakeviz 只需 pip 安装即可。直接、美观方面,gprof2dot 会把结果生成为图片,图片效果不如 snakeviz 的网页美观,如果 profile 的脚本较为复杂的话,图片过大内容过于密集,很不方便查看。